COLLECTING AND REPRESENTING DATA
We are learning about:
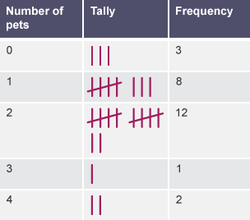
- Tally tables
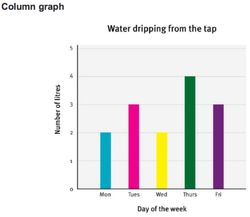
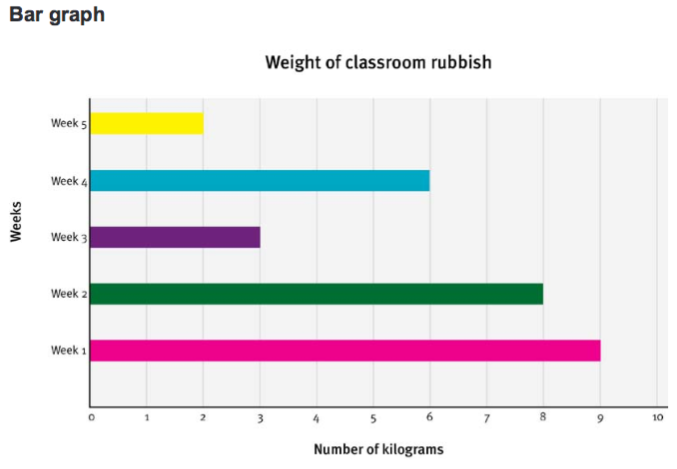
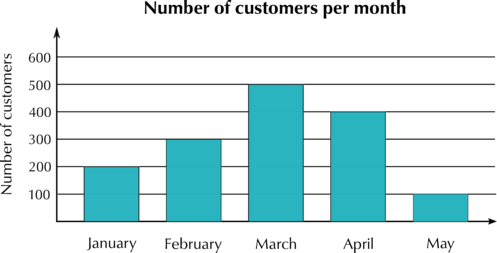
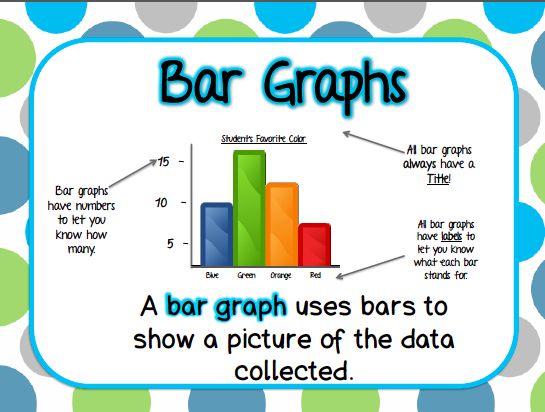
- Column Graphs/ Bar Graphs
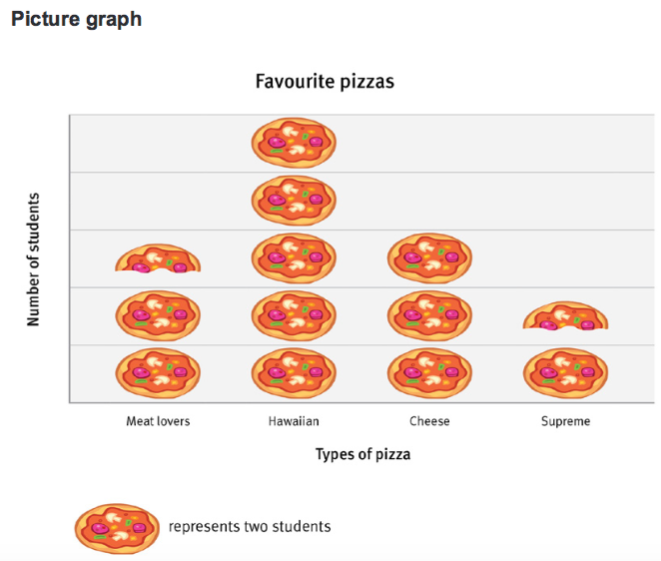
- Picture Graphs
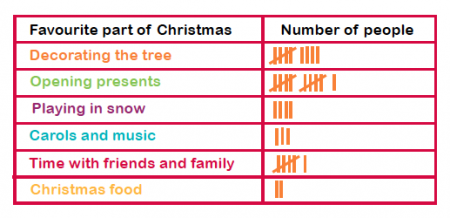
- Tally tables
- Column Graphs/ Bar Graphs
- Picture Graphs
|
|

Watch the video on data (comparing data)
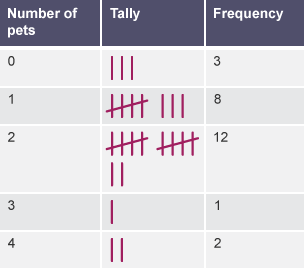
Click on the images in the gallery below to see examples of different types of graphs:
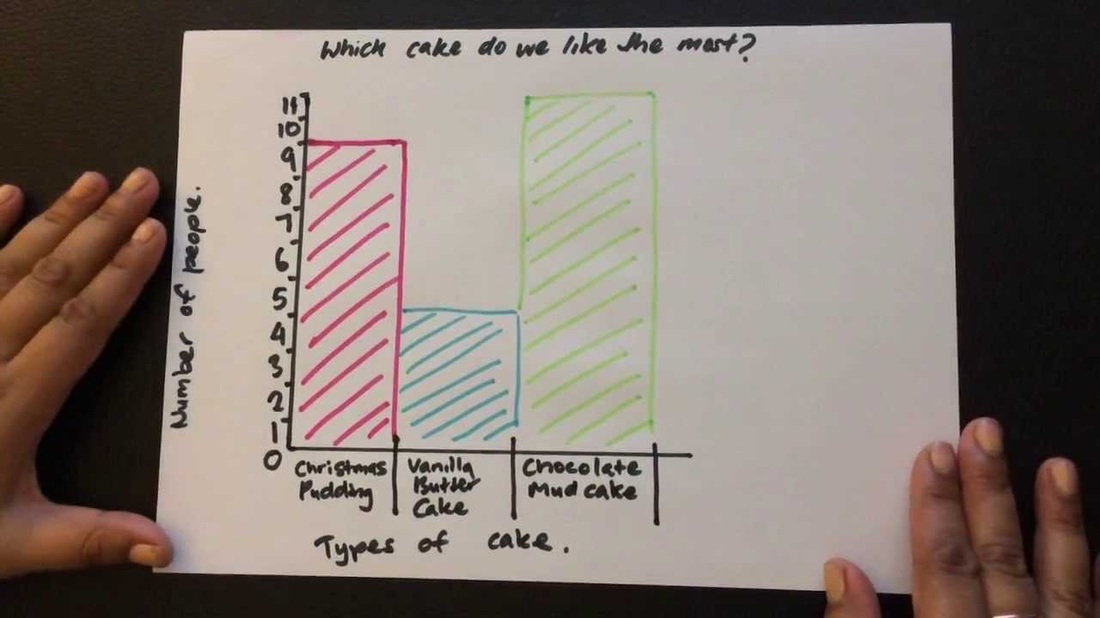
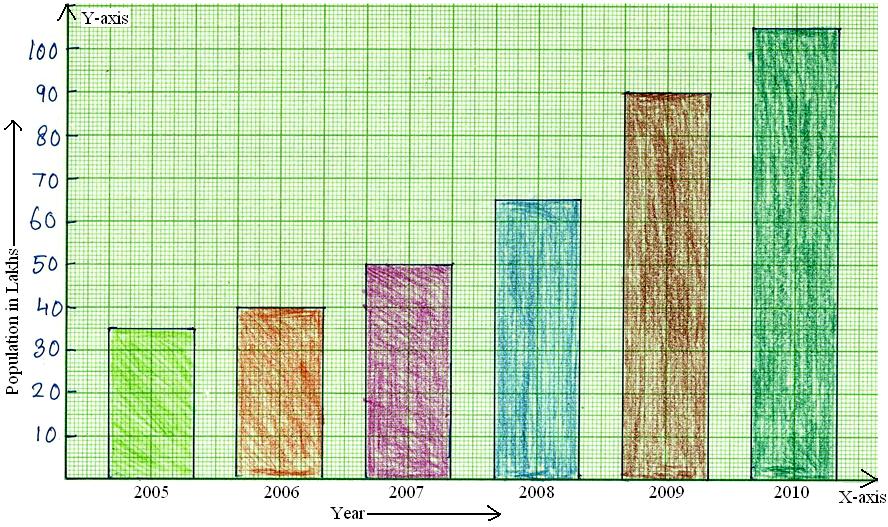
Collecting and interpreting tally tables and column/ bar graphs:
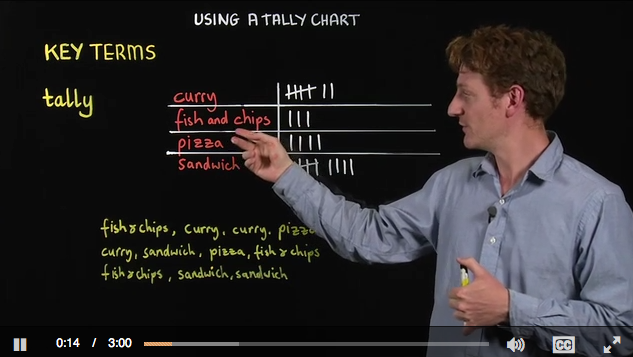
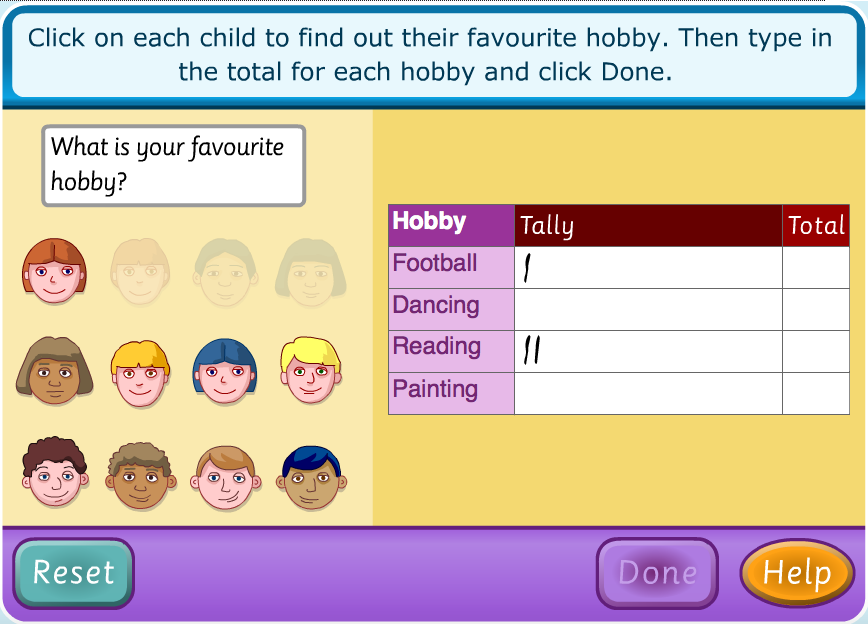
Surveying using tally charts
|
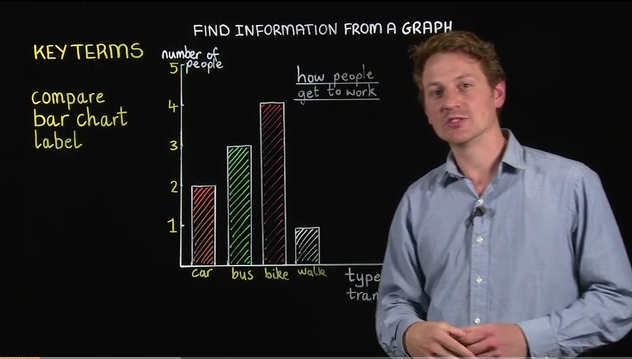
Finding information from a graph
|
|
|
|
|
LESSONS AND ACTIVITIES
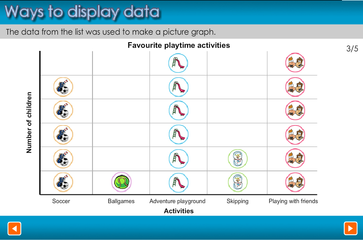
WAYS TO DISPLAY DATA
A simple online presentation showing different forms of data representations
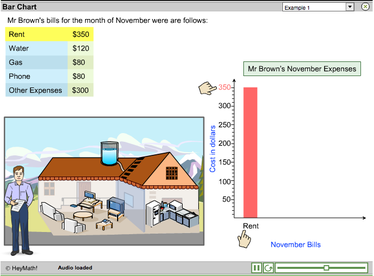
DRAWING COLUMN GRAPHS
This includes three examples of how to construct column graphs (also known as bar graphs) to represent data. It also highlights the features of column graphs. Students can use an included set of practice questions to determine their knowledge and understanding of column graphs
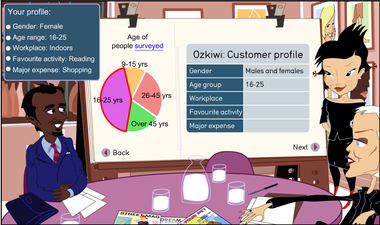
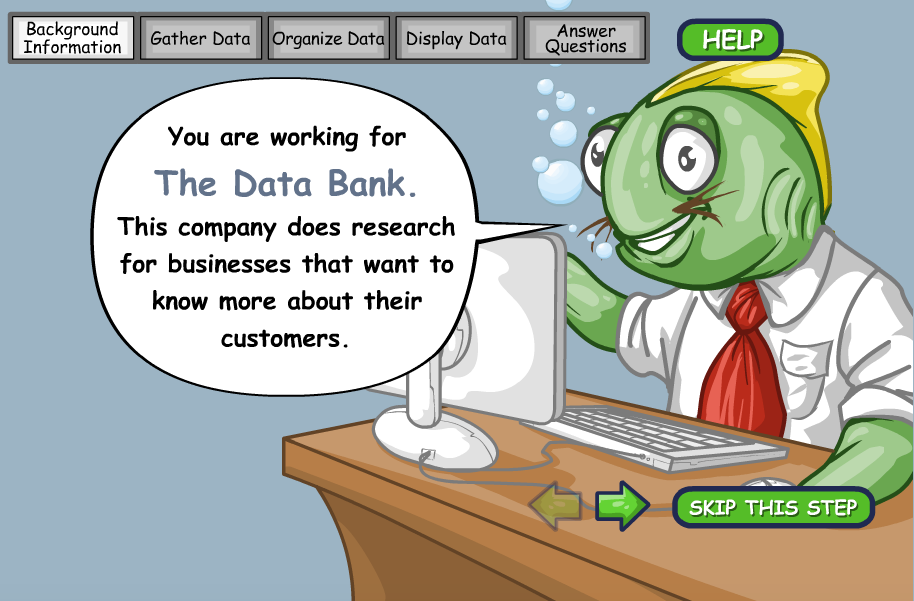
Fashion Design: Market Research
Now it's your turn!
Survey people to find out the most common gender, age, workplace, hobbies and major spending habit. Then analyse the results and review pie charts and customer interviews. As you go, click on underlined words to learn their meanings as they can get tricky.
Now it's your turn!
Survey people to find out the most common gender, age, workplace, hobbies and major spending habit. Then analyse the results and review pie charts and customer interviews. As you go, click on underlined words to learn their meanings as they can get tricky.
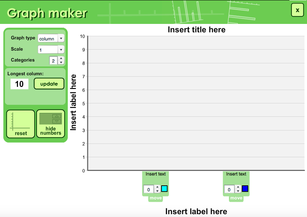
ONLINE GRAPH MAKER
After collecting data in the form of a tally table. Use this graph to demonstrate to the class how to make and label a column graph
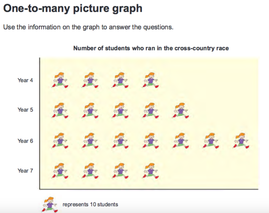
PICTURE GRAPH: ONE-TO-MANY (Printable activity sheet)
You could use this for homework or in-class activity. Test your understanding of picture graphs using this sheet
HOMEWORK/ CLASS ACTIVITY
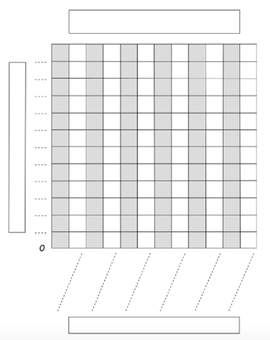
Choose any topic you like to interview people on. For example you might like to interview students in 4T on their favourite sport. Then create a tally to record your data. Once you finish all interviews, use the empty Column graph (click on the image to print) to place your tally scores into the graph.
You could also create a picture graph instead, using many-to-one concept. For example: = 2 votes.
Click here to get a blank picture graph
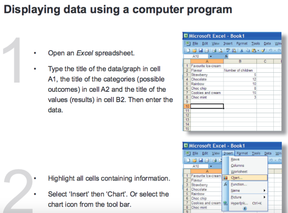
MAKING A GRAPH USING EXCEL
Print this valuable step-by-step instruction describing how you are capable of producing graphs on Excel
Syllabus: ACMSP096
"Construct suitable data displays, with and without the use of digital technologies, from given or collected data. Include tables, column graphs and picture graphs where one picture can represent many data values"
ANALYSING AND UNDERSTANDING DATA COLLECTED
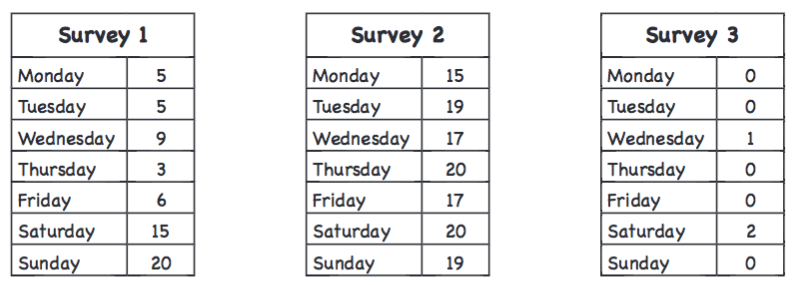
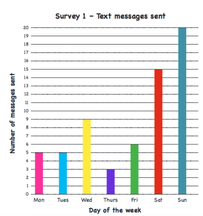
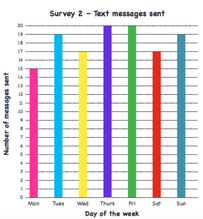
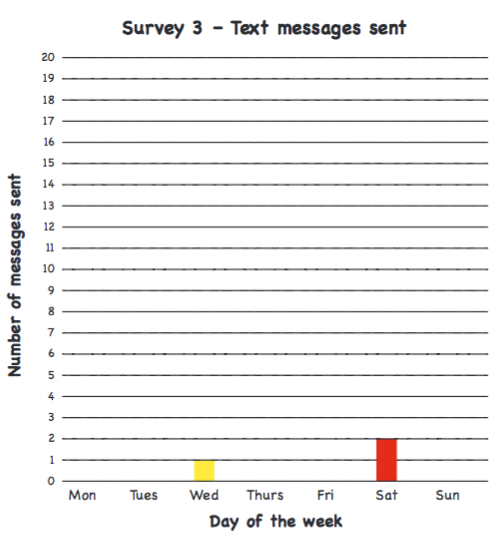
A research company asked three people how many text messages they sent each day for a week. Tables below show the data the research company collected.
Your task:
1. Check the data has been represented correctly in the graphs below.
2. Can you think of reasons why the data is different for each survey?
Your task:
1. Check the data has been represented correctly in the graphs below.
2. Can you think of reasons why the data is different for each survey?
|
|
|
GAMES
Practice all the skills you need in Data in this one game!
Help the jelly fish snack factory see which flavours are the most popular with their customers. You then need to order the data in a tally and then a bar graph
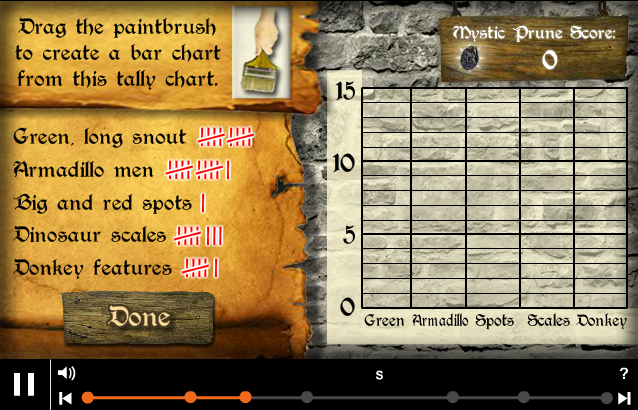
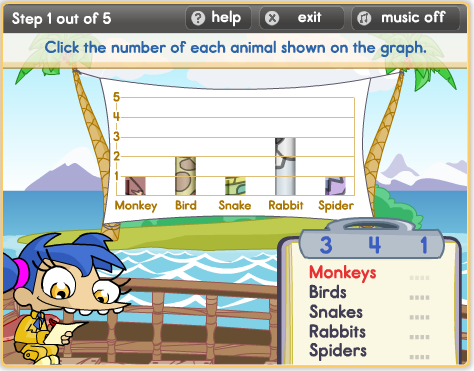
Collect data by tallying and then make a bar graph or a picture graph of the results
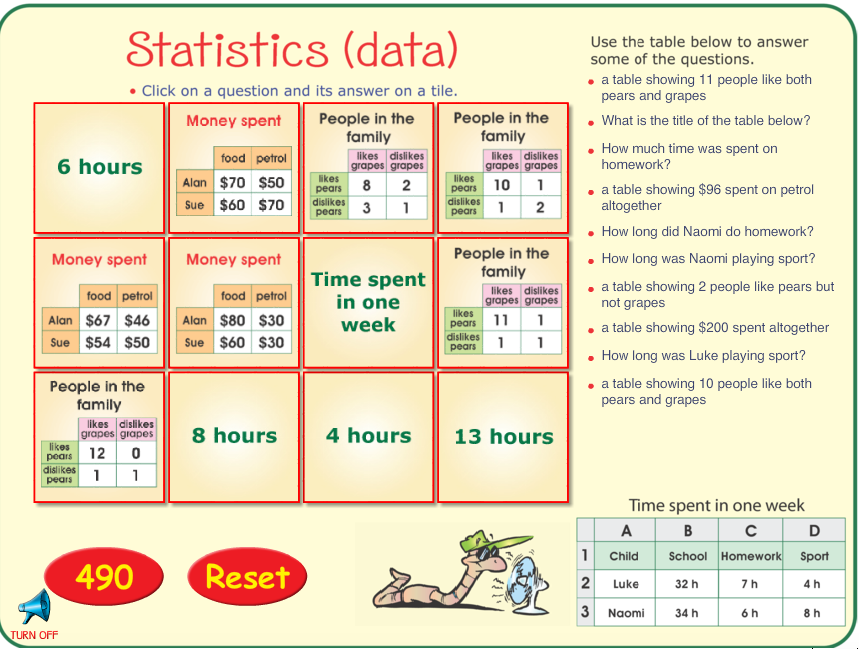
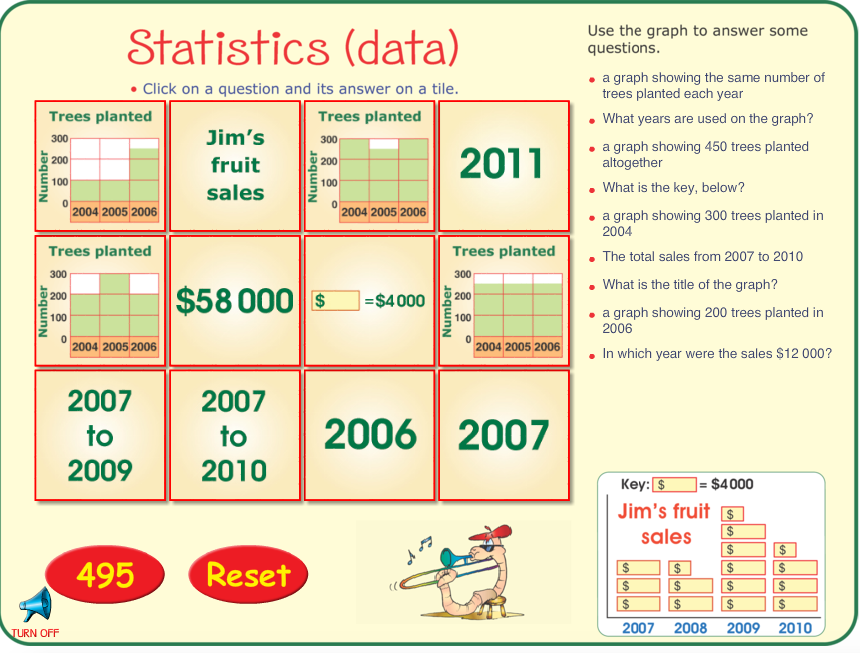
Choose a question and then select the tile with the right answer. All about data!
Reading and interpreting tables
Tallies, picture graphs, pie graphs, column graphs and more
|
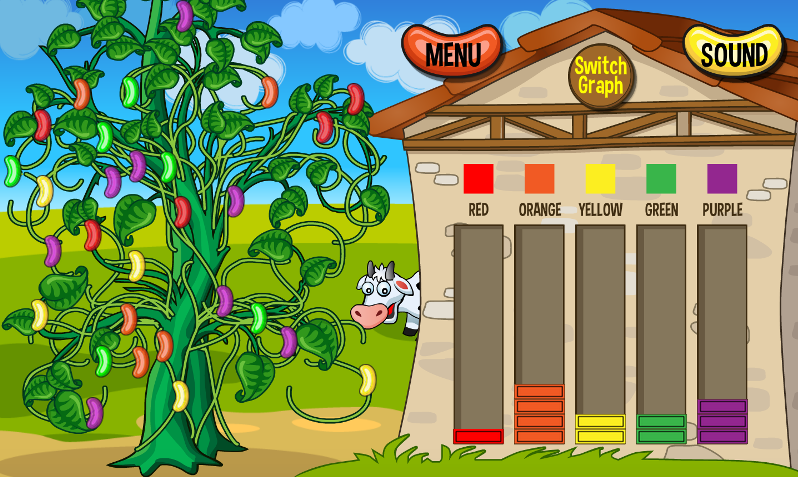
Graphing; Data Analysis. (for PCs, Mobiles etc) Pick the jelly beans and drop then in the bar graph or pie chart
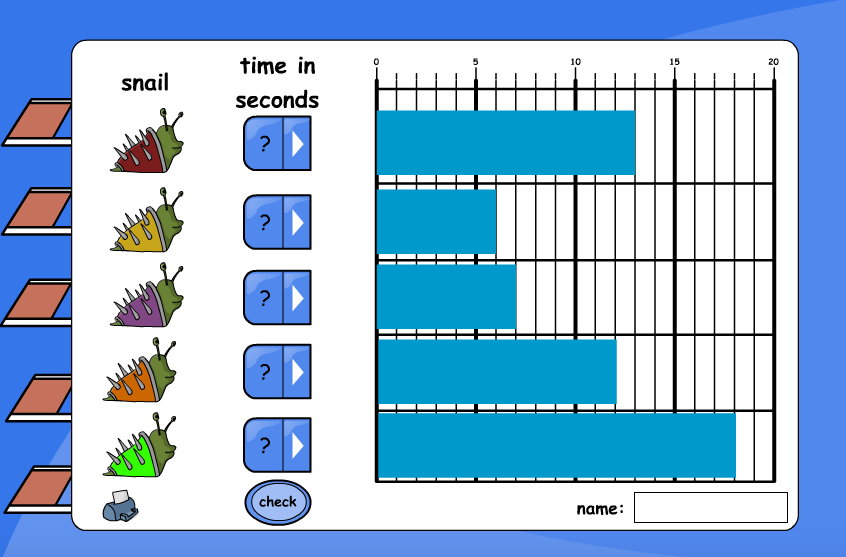
How long did it take each snail to finish the race?
Picture and column graphs
Reading and organising data
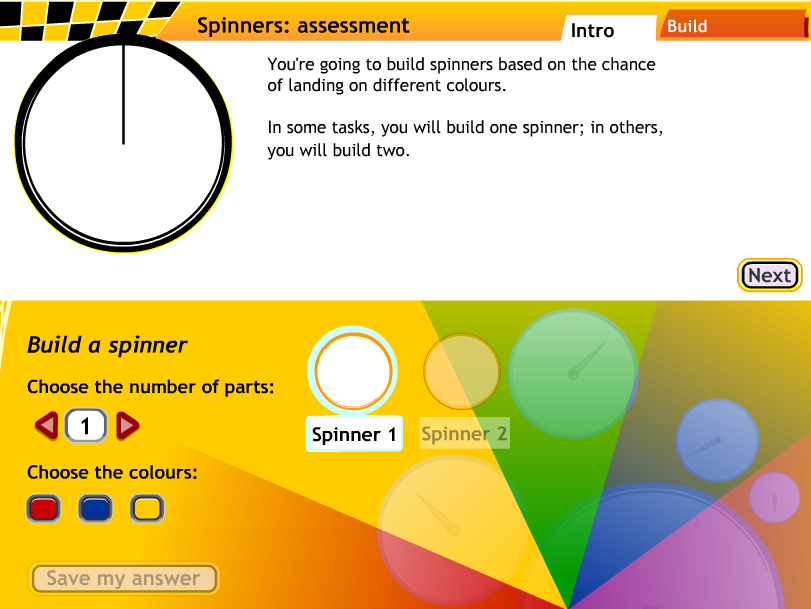
Spinners chance and data assessment
|
Language/ Terminology
|
Data
Collect Survey Recording sheet Rating scale Category Display Symbol Tally mark Table Column graph Picture graph |
Vertical columns
Horizontal bars Scale Equal spacing Title Key Vertical axis Horizontal axis Axes Spreadsheet Misleading |
